
Cricket pitches are different sizes. This is an inherently obvious fact, but one which is excluded when cricket statistics are involved. Two major factors contribute to differences in cricket grounds: length of boundaries and preparation of the wicket. Baseball traverses the issue through the use of park factors to account for varying field sizes, which has become primary components of stats such as OPS+ (On-Base plus Slugging Plus, which takes the normal OPS statistic then normalises it across the whole league), allowing for standardisation of player’s scores and more apt comparisons between them. With baseball sharing the similar component of boundary sizes being different in each park (and occasionally altitude in the case of Coors Field) the same concept should be able to be applied to cricket in order to better evaluate player performances. As by placing each player on the same ‘playing field’ they can be measured against each other without their statistics being altered by external factors.
How can the ground factors be found?
Ball tracking would be the most effective way to compare the outcome of each ball in order to create standardised results for each shot played. It would allow for sixes to be worth their true value on each ground and estimates to be drawn on whether twos would turn to fours or fours be able to be stopped before the boundary. It would also account for differences in field settings which are forced due to different distances needing to be covered to stop a boundary. However, as I lacked the data of every ball which has been tracked in a 3D plane in the last ten years I sought to follow the next best (and much easier approach) of comparing the number of ones, twos, threes etc. scored on each ground in order to compile a chart showing how these numbers compared to the league average over the last ten years.
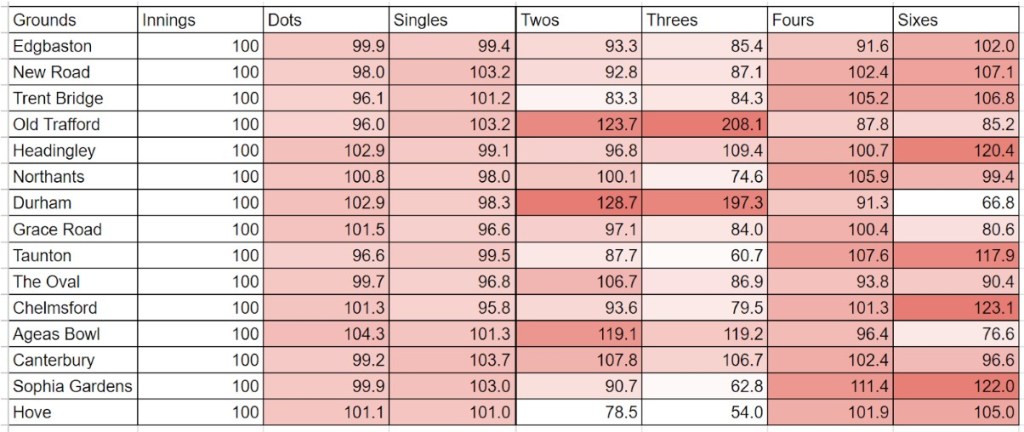
This produced the table seen above. The table is presented as index numbers, with 100 representing the mean number of each scoring type and differences from 100 showing the percentage change between locations. Some quite clear observations can instantly be drawn from the chart. All grounds have very similar numbers of dots and singles scored on them, with fluctuations of not even 5% from the mean above or below. Threes have the greatest fluctuations as a result of having the smallest sample size, but even so have to be included as grounds with long boundaries inherently have more threes scored. Finally as assumed, the amount of sixes also has great fluctuations due to boundary length. Also with the number of sixes scored in t20 tournaments rising significantly in the 10 year time period, these discrepancies may grow as some grounds move boundaries inwards in order to boost attendance.
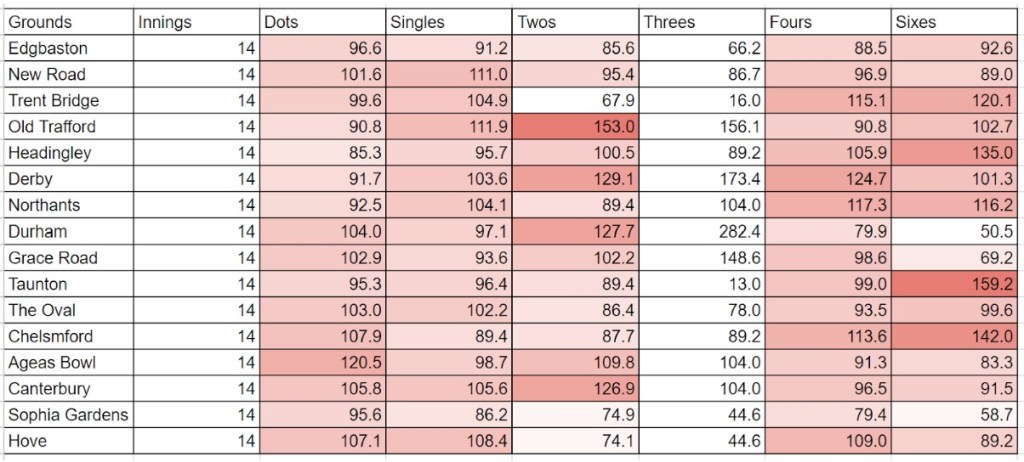
The changes can even be seen through a comparison of the last ten years to the smaller sample size of the 2022 season. Sophia gardens for instance, over the past 10 years has had 22% more sixes scored than the mean, but in 2022 was 41.3% less. This likely can be attributed to various factors such as the subpar performances of Glamorgan at home with a 3-4 record, as well as innings being shortened due to rain or play having to be called all together in the middle of an inning. It is likely this will regress to the mean in 2023 and beyond. There are obvious similarities at the same time, with Taunton’s extremely favourable six hitting conditions becoming ever more favourable in the 2022 season. Coinciding with an excellent campaign and emergence of young stars such as Will Smeed and veteran performances from Rilee Roussow. Chester-le-Street (Durham) continued to see issues in hitting the long ball, where 2022 saw 49.5% below league average, further below the 33.2% over the last ten years. This indicates that players who play at Chester-le-Street are required to work harder to score their runs than players at Taunton. In order to compare their skill, changes must be made.
The Obvious Limitations
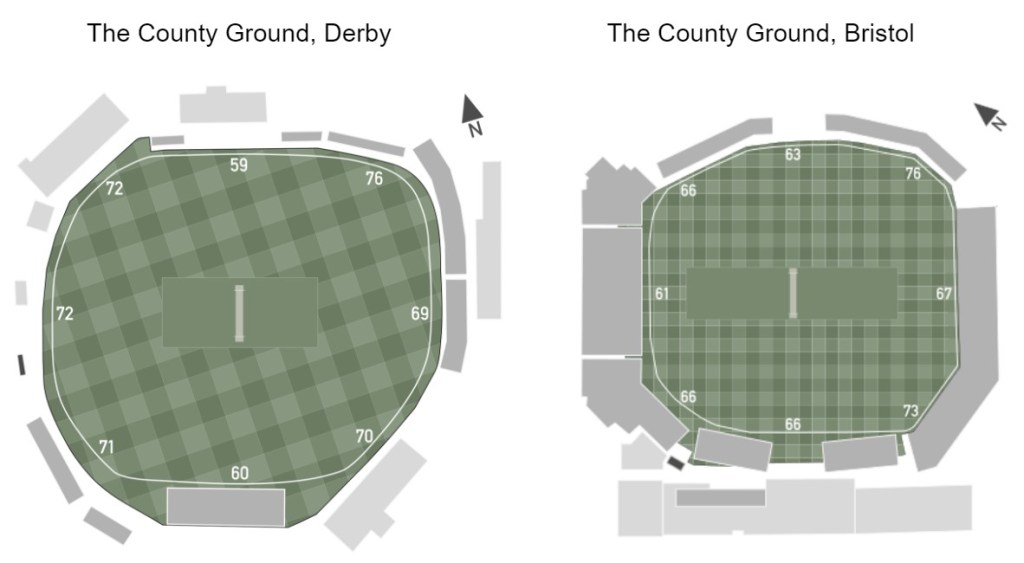
However much I would like to say the problems with the model are limited to distances of sixes and preparations of wickets not being accounted for, it would be a stone cold lie. ‘Ask Cricinfo’ (Cricinfo’s AI search engine which I used to collate data, as it responds to accurate prompts in a way no other service does) had problems with trying to process what I meant by ‘The County Ground, Derby’, meaning that Derbyshire is excluded from the statistics over the last ten years. As seen later, where I provide examples of some adjusted run totals, I took scores at Derbyshire at face value and provided all the runs scored to the players final total. This was an ample solution for the players who only played one game out the county ground, but for both Shan Masood and Wayne Madsen who scored the fifth and ninth most runs in the blast respectively, I had to leave them out of the adjusted scores. With Derby having the shortest straight boundaries in county cricket at 60m and 59m this seemed fairly reasonable. The south group also didn’t escape the issue, with the County Ground Bristol also lacking stats. When comparing these grounds they do have some similarities with short straight boundaries and longest in the Cow Corner region. The main difference is the 61m boundary square of the wicket found in Bristol. Even so, I took the same solution with both grounds and was fortunate enough to not have any Gloucestershire players in the top ten run scorers.
The other problem was Middlesex. Fortunately enough, their 4 and 10 record meant they had no players in the top ten run scorers, but with their home ground being the ‘Home of Cricket’, they didn’t play many games at Lords. Electing to play their fixtures at Radlett Cricket Club, the small sample size and lack of data about the ground provided a similar issue. With a high score of 229/9 in only six innings played at the ground, placed it as the 8th highest innings total of the season (just showing what a batter centric tournament the Blast has become). The only other temporary ground which hosted games was Stanley Park, with only one fully completed match and the other being rain affected. Although the scores across the innings played weren’t outrageously high, the small sample size gives no indication as to how comparable the ground is to other County grounds. Fortunately this only affected the scores of Steven Croft, who accumulated 113 runs across his two innings at the ground. Nevertheless, the problems presented require for the adjusted scores to be taken with a larger pinch of salt than they already were, due to the lack of using ball tracking.
Looking at adjusted scores for the 2022 Season
Rilee Roussow is a great cricketer. He averages 34.86 across 27 innings of T20 internationals and has played at the top level in cricket leagues around the world, including the IPL and Vitality Blast. As Roussow moved into his 4th year of the Blast he made the decision to offer his services to Somerset from Hampshire, allowing for him to play half his games at the hitter friendly ground of Taunton. The 2022 season saw Roussow’s production nearly triple from some of his previous campaigns. Although he only scored 170 runs across 11 innings in 2019 and his best year of 2017 saw him score 255 runs in 10 innings, 2022 showed Roussow thriving. Scoring 623 runs in 16 innings, at an average of 47.92, allowing for Roussow to land himself second on the list of Vitality Blast run scorers for the season.
How good was Roussow in 2022? By adjusting eight of the ten top run scorers total runs to the environment’s they played in (by dividing each number of ones, twos, threes etc. by their percentage difference from the mean (if the number of sixes was 117.9, that was divided by 100 to become 1.179), then multiplying the adjusted number of each scoring amount by the run value and totalling them). Roussow can be seen to have gained the greatest benefit as a result of the ground he played at, gaining 39.6 runs over what he would have if all players played on the same sized grounds. Ben Mcdermott and Chris Lynn lost out on the most runs as a result of the grounds, with Lynn’s total being particularly impressive as it was only over 10 innings.
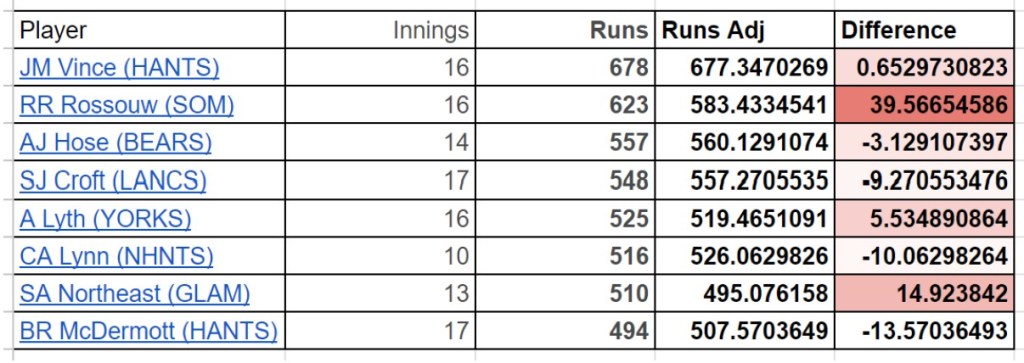
Therefore, even though Roussow had a very productive season which saw him score the second most runs in the season even when adjusted, it arguably isn’t as close to James Vince as once thought, who gained very little extra run value when he was playing. Roussow saw 32 of his 40 runs gained from his play at Taunton alone, whereas Vince was seen to be robbed of 10 runs as a result of playing at the Ageas Bowl. The main way Roussow was seen to be gaining runs at home was in the number of sixes he hit, which were adjusted from 29 to 24.5. Only by using ball tracking data would you be able to tell if this was an accurate adjustment, as if you ask anyone who was watching Roussow bat, he wasn’t only just about clearing the short Taunton boundaries.
Why is this important?
Accurately being able to compare players provides the basis of a large portion of the job of selectors, coaches and more. Even using total runs scored (as I have) is a relatively meaningless stat as it hasn’t accounted for the different number of innings played by each player. Cricket, like baseball, provides a sport where players have to adapt to surroundings which alter the flow of the game and they have no control over, one of the reasons it is so rewatchable and exciting. But these differing conditions can lead to players becoming overvalued and inflated stats can hide flaws in their game, which selectors have to navigate around in order to find what they need. It seems stupid to me that cricket doesn’t have innovative stats which take into consideration the grounds teams play on, or compare them to the league average (however, I’m sure large corporations such as Cricinfo and Opta have all the data hidden from the public). The reason for this, seems to be the smaller sample size. As anyone who has tried to lie with stats knows, a small sample size is your best friend to do it. So frankly over a 14 game cricket season compared to a 162 game baseball season anomalies won’t be ironed out and players can’t be evaluated in a way which is useful to people who use the data the most. Until that is resolved, the “eye test” will continue to be king.

Leave a comment