
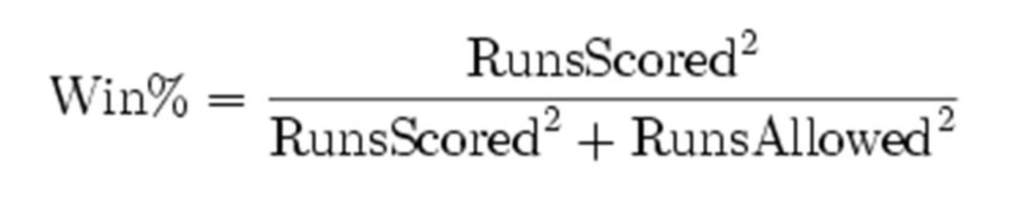
It’s near impossible to traverse an article written about sports statistics or sabermetrics without stumbling across a reference to ‘Moneyball’, so I may as well start with one. In an early part of the film Peter Brand (played by Jonah Hill), walks Billy through “the board”. Displayed upon it is “Bill James’ Pythagorean Expectation formula” which Pete uses to explain to Billy that by scoring a certain number of runs and conceding fewer than a certain number the Oakland A’s should be able to make the postseason for that year.

The formula in question is simple in its appearance, but still provides valuable insight into whether a team is over performing or underperforming based on their run differential. As well as Pete’s usage of calculating the amount of runs a team should need to score to win a number of games. By knowing some of the usage, we can now turn to how it may be able to be applied to cricket.
The 2023 IPL Season
I chose to explore this concept by solely focussing on the 2023 IPL season. Not only does the IPL have readily available data which could be applied to the task, but the limited overs plays a much greater resemblance to baseball from which the concept is based, unlike the four day games of the county championship.
The first task I had to set out to accomplish was finding runs scored values and runs conceded values which would take into consideration whether each team had been able to bat the full 20 overs in each match. I was aiming to adjust for the fact that every team plays a different number of overs through the course of a season. This took three alterations, the first being much simpler. If a team hadn’t batted out the full 20, I took their current run rate at that point in the game and extrapolated so that they would have fulfilled the 20 overs. The issue with this is that it fails to consider the changing run rates as wickets fall and the possibility of a team being bowled all out within the time frame.
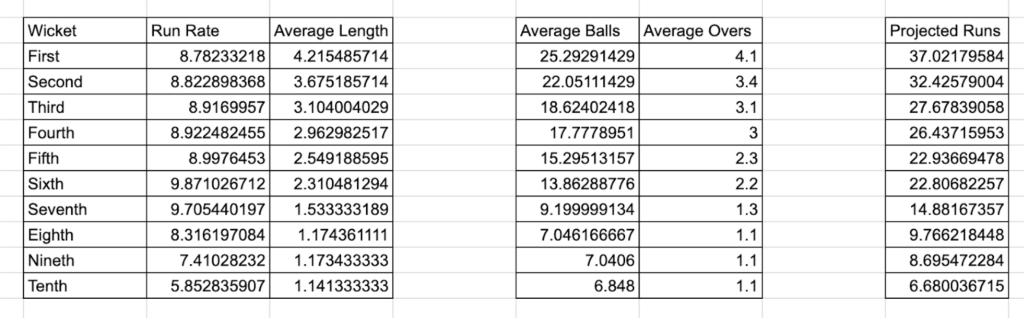
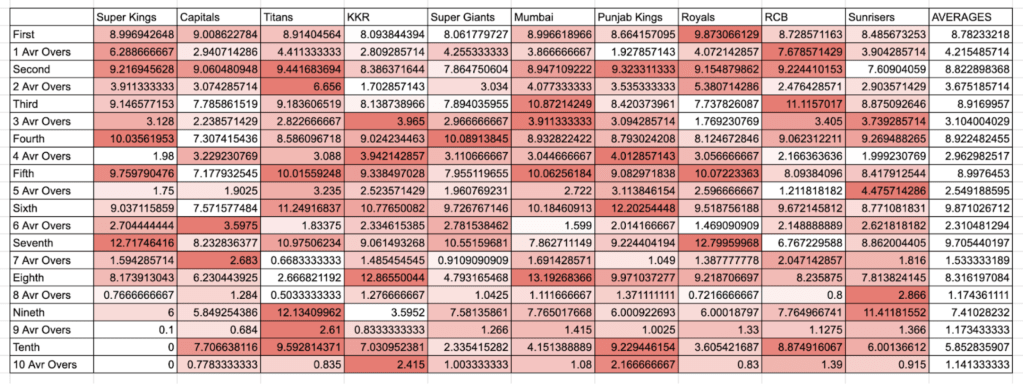
By logging every partnership for every wicket by every team in the IPL for the year, I was able to calculate the average run rate and length of partnership for each wicket, both for every team and for the league as a whole. This allowed for a revised set of projected scores, where each team then batted as an average team for the remainder of their innings, with wickets falling at the average length and the teams scoring at the average run rates per wicket. I did this both with the league average and for the average of the team itself to create the three options. (The chart shows each team’s run rates for each wicket, marked as First, Second etc. then the alternating rows are the average length of each partnership of each wicket).
Now with both these tools at my disposal, I had team totals of runs scored and runs conceded, calculated by the three different methods. All I needed now was a way to find an ‘Bill James’ style exponent which would provide the greatest correlation with the actual winning percentage of each IPL team.
AI is the future
I can’t code. I have tried learning on multiple occasions and am again within the process of doing so. Fortunately enough for me, I am literate enough to type requests into Chat-GPT to give me the code which will do my bidding.
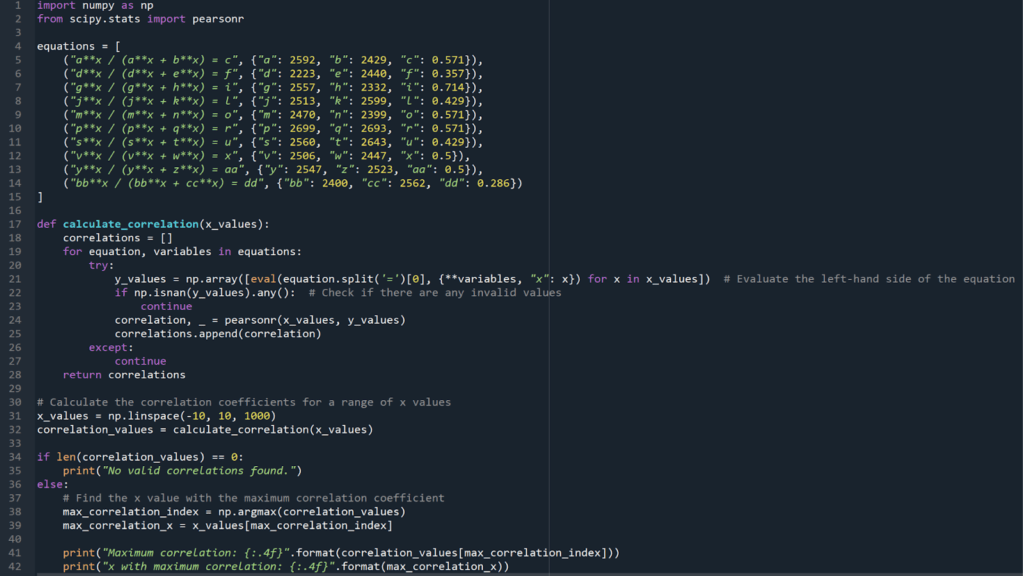
The code takes the adjusted runs scored and conceded values which I inputted, then finds the value of ‘x’ (representing the exponent) which provides the greatest correlation with the actual winning percentage of the team which I also entered. The code provided me with three different values for ‘x’. The current run rate extrapolation method provided a value of 9.8999. League average batting method gave a value of 9.8398. Finally the team average batting method provided a value of 9.8599. But which of these turned out to be the most accurate method?
A challenge I faced while creating this experiment was thanks to the events of May 3rd 2023. This matchup between the Super Giants and Super Kings came with difficulties as it was the only game of the IPL with a no-result. As it was called off while Lucknow were 125/7 and yet to complete their 20th over. My solution in the end left much to be desired as I awarded both teams with the league average score of 178 runs. Of course this is a bad estimate, Lucknow were never making that many and there’s no evidence the Super Kings would have either. Here’s where cricket takes a drastic turn from baseball and it’s all about the state of the pitch being played on.
What has a greater effect on runs scored? Players or Conditions?
There’s a very obvious answer and it is of course the players playing. But that is only when they are put up against an opponent, which is always seen in a game, so the winning team will likely have the better players. This isn’t as comparable across games and across stadiums, however. I’ve already discussed at length the benefits of playing at a small cricket ground for the amount of runs a player will score over a season, but that is similar to baseball. The wicket is the difference. Average degrees of swing, average degrees of movement off the pitch, amount of bounce when being bowled at a good length: are all things that are more greatly altered by the pitch than by the bowler. In turn these will have a greater effect on the performance of the batsman than the batsman themself from day to day.
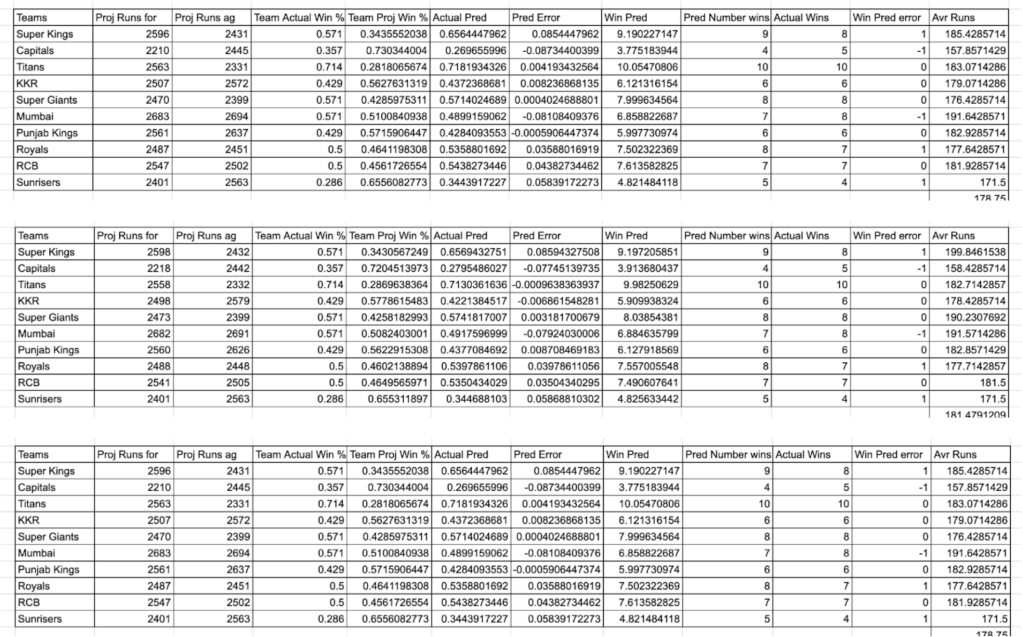
Why do I bring this up in the first place? When looking at which method had the greatest correlations between winning percentage and runs scored and conceded, the method using extrapolation from current run rate had the lowest error rate of the three. All three of the methods were very close in the error rates. It is helpful as it poses the question of how much do teams’ run rates over the course of the season bear effect on their run rate in a particular game and how much is determined by the run rate in that game itself?
The run rates extrapolation method had an error rate of 0.03823884664, league average had 0.03958681436 and team average had 0.04053955448. Below are the predictions which each model made based on the runs scored and conceded and each can be seen to have the same number of wins predicted as the other.
Small sample size provides a lot of the difficulty with this method and only by testing it with other IPL seasons and seeing the correlation will we determine if it is an accurate way of determining if it is useful.
Billy, we need to score at least 814 runs…
“My job is to get us to the playoffs. Everything after that is f****** luck” – Billy Beane
Eight games. Over every season of the IPL, eight wins has guaranteed a team a spot at a playoff run, a 57% win percentage. If I owned a franchise in the ICTL (Indian Coin Tossing League), it would be a surprise to no one if I had made multiple playoff berths while being completely asleep at the wheel.
Let’s break this down then. If we gather the most average bowling attack for our 14 games, who are hit for 178 runs a game without fail, we will concede 2492 runs. By rearranging the equation and using a coefficient of 9.8999 (the one which provided highest correlation), we find that the amount of runs we need to score is around 2564. That would require scoring at an average run rate of 9.16 over the course of the season. Three of the four teams who qualified for the playoffs broke that threshold and 4 teams in the league scored over 9.16 an over. The Punjab Kings were the unfortunate standout as they conceded 2564 runs across their 14 games. The Super Giants were the only playoff team not to live up to the threshold due to the help of their very efficient bowling attack. RCB were right on the cusp but again let down by the bowling. Of course I need to mention that the 2564 runs needed to score and 2492 or less to concede are extrapolated totals if they were going to play every ball of every game. So in turn limiting the opposition to a run rate of 8.9 or fewer is perhaps a more apt comparison.
So a team where every player has 152.7 SR should make the playoffs right?
Digging deeper you probably want a player with a boundary rate between 17% and 33% and a very high equivalent to BABIP (batting average on balls in play). For context Jos Buttler had a boundary rate of 0.22 in the 2022 IPL, but only a strike rate of 149. Actually forming a team with this statistical profile is almost impossible without looking further into where they are good at hitting the ball and how they perform when balls are bowled in different areas. Cricket is a cruel game so thinking it could possibly be this easy is a slight farce. Perhaps by analysing performances of players on wickets with varying bounce or higher degrees of spin, at the toss you could have a team which would better fit the “9 out of 10 times bat first” narrative (of course the tenth time you should think about bowling and then elect to bat first anyway), making a team that suits every wicket you play on.
I have completely neglected to talk about the other side of the game, bowling, which is an obvious solution to lowering the required 152.7 strike rate over the course of a season. The answer is simply yes. The less you concede the less you should have to score. If my team only concedes at 8.5 an over, we should only have to maintain a 145 strike rate. In the IPL, where the average strike rate is 141.7, it isn’t looking as difficult. If you had been a part of the Gujarat Titans, who’s bowlers conceded the fewest number of projected runs, you would only have had to score at a strike rate of 142.8, very close to the league average.
What did any of this tell us?
Mumbai shouldn’t have made it to the eight win threshold, whereas the Royals should have. Of course this can never be entirely accurate, but it suggests that Mumbai had more luck or were more “clutch” (hitting important shots at important times, or taking important wickets when needed most) than other teams this year. With clutch being a really interesting thing to look at in baseball in my opinion, as a Padres fan, who’s team don’t seem to know the meaning of it this season, it’s important to understand how important luck and clutch are to sports. They keep the excitement, they keep people watching. Were the 2023 Royals a better team than the 2023 Mumbai Indians? Well despite Mumbai winning the head to head, you’ve now got some more stats and supporting evidence if you ever want to engage someone in a question on that slightly bizarre topic.
This idea will never stop being an interesting idea to me. Everything I started working on originally, looking at park factors and now Pythagorean expectation was to build a Wins Above Replacement model for cricket. Boiling a whole player’s season into one number is such a crisp, clean solution in the modern day, where 80% of sports fans analyse the game from the scoreboard (pundits and commentators are largely to blame for this, not all of course). Shohei Ohtani has 8.9 fWAR this season. It’s the most in the major leagues, but partly thanks to his injury it isn’t the most of all time (although probably wouldn’t have been despite his once in a generation play and talent). You only are able to gain appreciation for just how mind-boggling a season he’s had by looking at his peripheral stats. You can learn a lot more about a player by the little red dots on his baseball savant page than you can any cricketer by staring at their profile on cricinfo. Cricket is so ashamedly behind baseball on its amount of available data, of course not that it has to be. But there is only so far you can go with extrapolation and averages, leaving gaping issues with models and holes in the logic. For now, however, I’ll be trying to find 11 guys who can score 152.7 runs in 100 balls and get out at a low enough rate to allow the team to fulfil our allocated overs, because that is my best judgment of how to win over the course of a season.

Leave a comment